
Now that you know how to inspect and pre-process an event log, we proceed with showing how to answer the questions related to the discovery plug-ins. Recall that a log is the only input for these kinds of plug-ins.
The questions answered in this Section are summarized in the table below. The first section shows how to mine the control-flow perspective of process models. The second matrix explains how to mine information regarding certain aspects of cases. The third section describes how to mine information related to the roles/employees in the event log.
| Question | Section |
|---|---|
| How are the cases actually being executed? | First |
| What is the most frequent path for every process model? | Second |
| How is the distribution of all cases over the different paths through the process? | Second |
| How many people are involved in a case? | Third |
| What is the communication structure and dependencies among people? | Third |
| How many transfers happen from one role to another role? | Third |
| Who are the important people in the communication flow? | Third |
| Who subcontract work to whom? | Third |
| Who work on the same tasks? | Third |
Mining the Control-Flow Perspective of a Process
The control-flow perspective of a process establishes the dependencies among its tasks. Which tasks precede which other ones? Are there concurrent tasks? Are there loops? In short, what is the process model that summarizes the ow followed by most/all cases in the log? This information is important because it gives you feedback about how cases are actually being executed in the organization.
ProM 6 supports various actions to mine the control- ow perspective of process models. In this tutorial, we will use the “Mine for a Petri Net using Alpha-algorithm” plug-in, see the figure below.
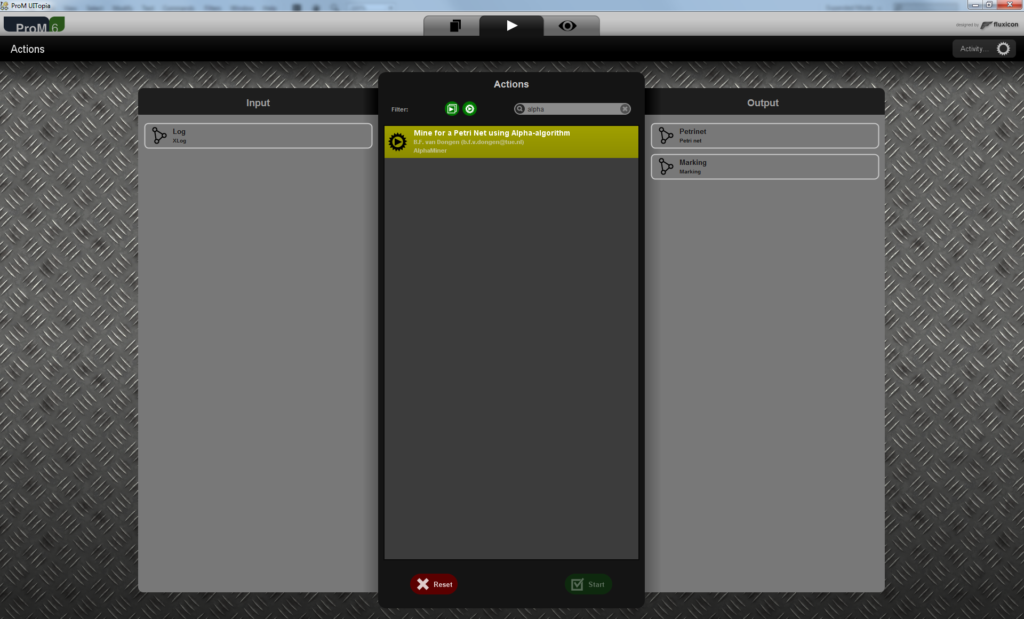
Figure 8 shows that this plug-in takes an “XLog” as input, and it produces a “Petri net” and a “Marking” (the initial marking of the Petri net) as output. To mine the log of our running example, you should perform the following steps:
- Open the filtered log that contains only the completed cases, or redo the filtering for the original log of the running example.
- Verify with the analysis plug-in Log Summary if the log is correctly filtered. If so, this log should contain 1000 process instances, 12 event classes, 1 start event (“Register+complete”), 1 end event (“Archive Repair+complete”), and 13 originators.
- Run the “Mine for a Petri Net using Alpha-algorithm” plug-in:
- Select the filtered log in the workspace view.
- Select the “Action” button. This will open the action view with the filtered log selected as input.
- Select the “Mine for a Petri Net using Alpha-algorithm” plug-in.
- Select the “Start” button.
- The resulting mined model should look like the one in the figure below.
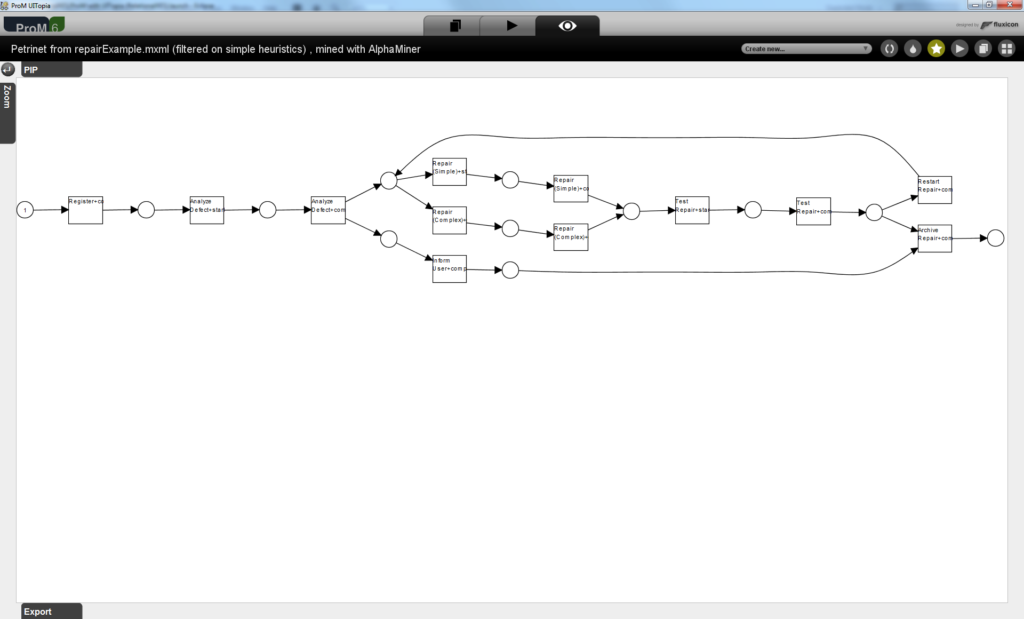
- Note that the “Mine for a Petri Net using Alpha-algorithm” plug-in uses Petri nets as its notation to represent process models. From this mined model, you can observe that:
- All cases start with the task “Register” and end with the task “Archive Repair”. This is not really surprising since we have filtered the cases in the log.
- After the task Analyze Defect completes, some tasks can occur in parallel:
- the client can be informed about the defect (see task “Inform User”), and
- the actual fix of the defect can be started by executing the task Repair (Complete) or Repair (Simple).
- The model has a loop construct involving the repair tasks.
Based on these remarks, we can conclude that the cases in our running example log have indeed been executed as described.
As a final note, although in this section we mine the log using the “Mine for a Petri Net using Alpha-algorithm” plug-in, we strongly recommend you to try other plug-ins as well. The main reason is that the “Mine for a Petri Net using Alpha-algorithm” plug-in is not robust to logs that contain noisy data (like real-life logs typically do). Thus, we suggest you have a look at the help of the other plug-ins before choosing for a specific one. In our case, we can hint that we have had good experience while using the mining plug-ins “Flexible Heuristics Miner”, “Inductive Miner”, and “Fuzzy Miner” to real-life logs.
Mining Case-Related Information about a Process
In this section we answer questions regarding the execution patterns in the event log. A few questions are:
- What are the most frequent paths in the process?
- Are there any loop patterns in the process?
- What is the distribution of all cases over the different paths through the process?
- Can I select a subset of traces where particular paths were executed?
- Can I simplify the log by abstracting the most frequent paths?
These and other related questions can be answered by using the Pattern Abstractions visualization. As an illustration, in the context of our running example, one would expect that paths without the task Restart Repair (i.e., situations in which the defect could not be fixed in the first try) should be more frequent than the ones with this task. But is this indeed the current situation? Questions like this will be answered while executing the following procedure:
- – Open the filtered log that contains only the completed cases, or redo the filtering for the original log of the running example.
- – Run the Pattern Abstractions visualizer:
- Select the filtered log in the workspace view.
- Select the “Visualizer” button. By default, you will notice the “Log summary” visualizer. Change the visualizer to “Pattern Abstractions (New)” as shown in below.
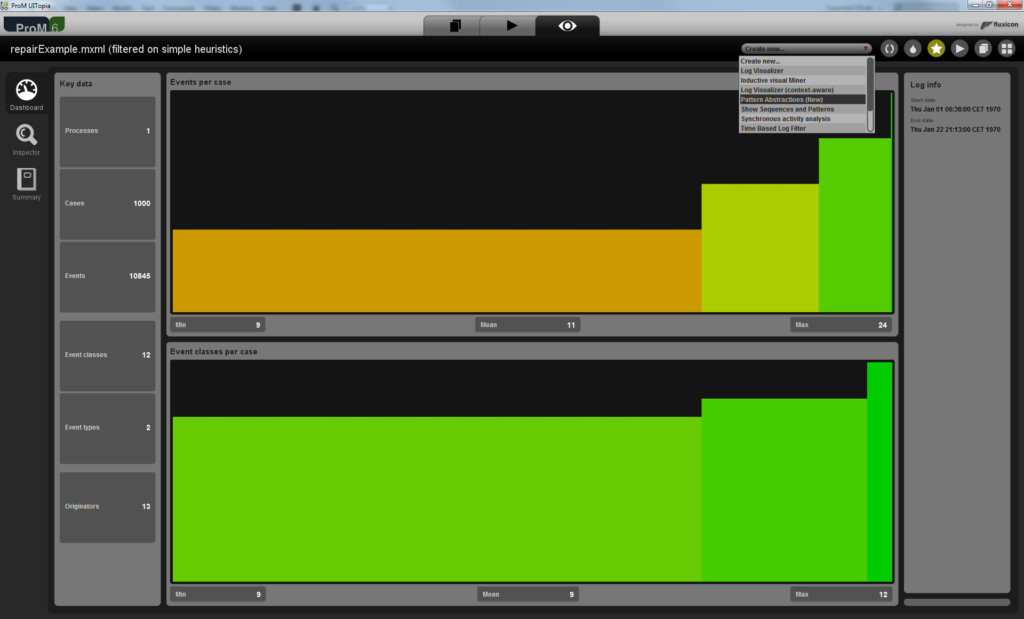
.. You should get a screen like the one below.
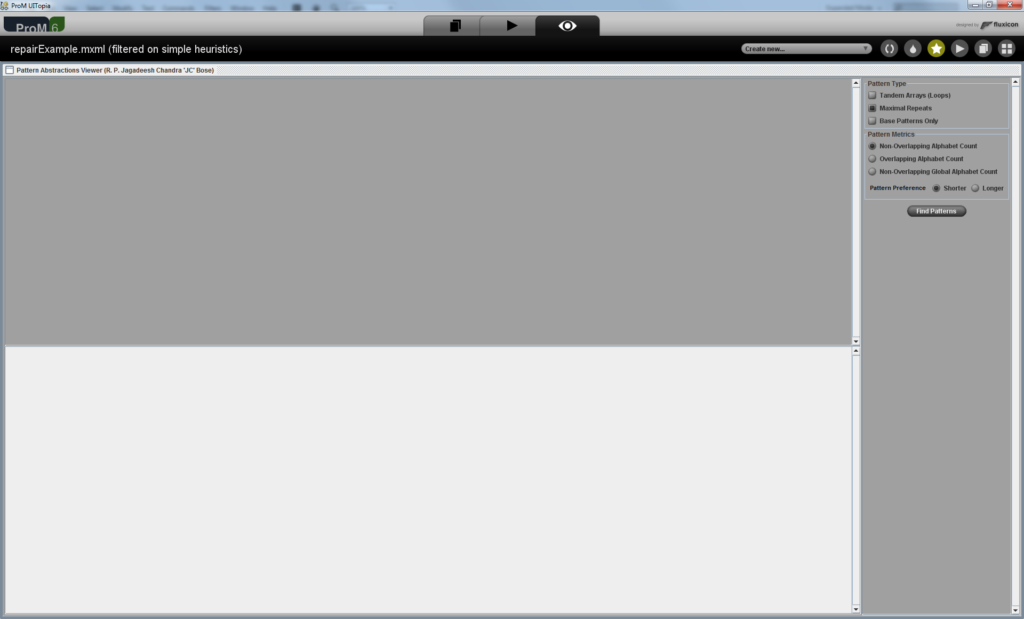
- Configure the parameters and execute the actions for the visualizer as mentioned below
- Choose the “Tandem Arrays (Loops)” and click “Find Patterns”. In order to find frequent paths not involving loops, choose “(Maximal) Repeat Patterns”.
- Uncheck the “Ignore Duplicate Traces” checkbox in the “Pattern Filters” panel
.. You should get a screen like the one in below.
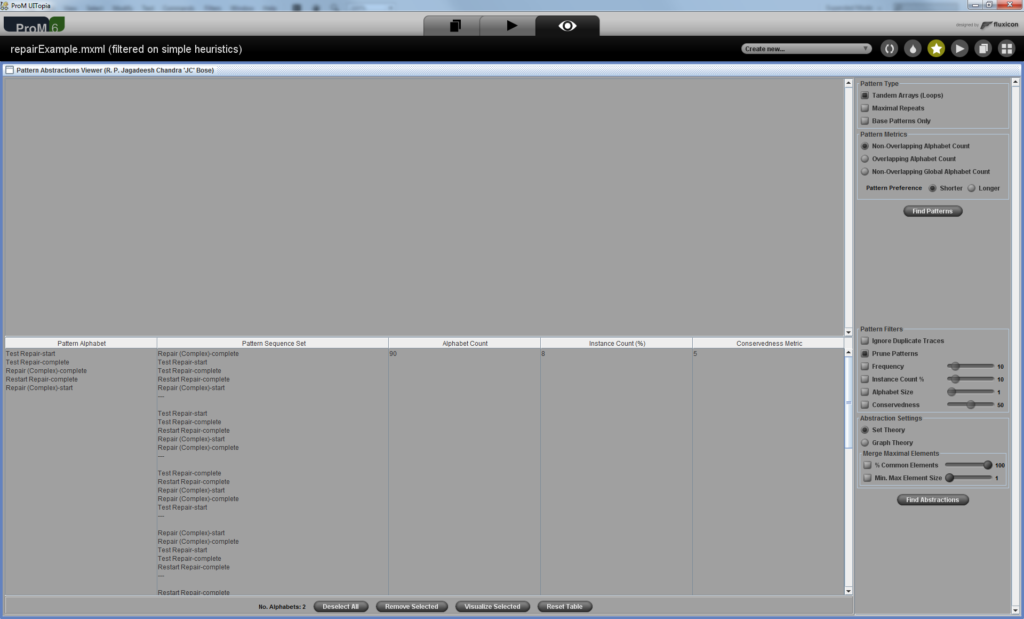
You can observe that the activity Restart Repair is involved in two loop patterns, one with “Repair (Simple)” and the other with “Repair (Complex)” procedures in conjunction with “Test Repair”. The value in the instance count (%) column gives the distribution of a particular pattern. For example, you can notice that in 21% of the cases, the Restart Repair is required following a “Repair (Simple)” procedure and in 8% of the cases where “Repair (Complex)” procedure was performed, a Restart Repair was required. This also implies that in 71% of the cases, the defects could be fixed in the first attempt.
- – Suppose, you want to extract the cases where a Restart Repair was required after a “Repair (Complex)” procedure was performed. You can extract those cases by doing the following:
- Click “Find Abstractions” Button. You should get a screen like the one below.
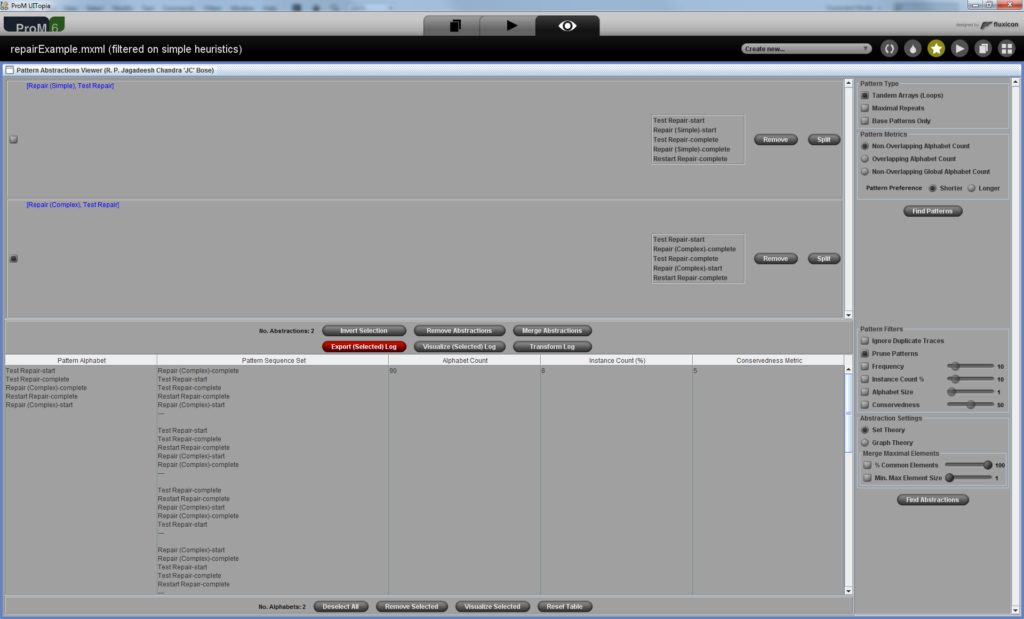
- In the top left panel, select the check box against the pattern (path) of your interest. In this case, against “Repair (Complex)”, “Test Repair” and “ Restart Repair”.
- Click “Export Selected (Log)” button. An event log containing only the cases where this particular path is executed will be pushed onto the workspace. You should be able to see the log with the name “Selected Abstraction Log”.
Take your time to have a look at the other options provided by this visualizer. For instance, by configuring the Filter options you can select specific mined patterns etc.
Mining Organizational-Related Information about a Process
In this section we answer questions regarding the social (or organizational) aspect of a company. The questions are:
- How many people are involved in a specific case?
- What is the communication structure and dependencies among people?
- How many transfers happen from one role to another role?
- Who are important people in the communication flow? (the most frequent flow)
- Who subcontracts work to whom?
- Who work on the same tasks?
These and other related questions can be answered by using the Social Network Miner plug-ins. In the following we explain how to answer each question in the context of our running example.
To know the people that are involved in a specific case or all the cases in the log, you can use the Log Summary. For instance, to check which people are involved in the process instance 120 of our example log, you can do the following:
- Open the filtered log for the running example.
- Select the “Inspector” tab.
- Select the “Browser” tab.
- In the “Instances” pane, locate the instance with ID 120, and select it.
The remaining questions of the list are answered by using the Social Network plug-ins. For instance, in the context of our running example, we would like to check if there are employees that outperform others. By identifying these employees, one can try to make the good practices (or way of working) of these employees a common knowledge in the company, so that peer employees also benefit from that. In the context of our running example, we could find out which employees are better at fixing defects. From the process description and from the mined model shown earlier, we know that telephones which were not repaired are again sent to the Repair Department. So, we can have a look on the handover of work for the task performed by the people in this department. In other words, we can have a look on the handover of work for the tasks Repair (Simple) and Repair (Complex) . One possible way to do so is to perform the following steps:
- Open the log for the running example.
- Use the “Filter Log using Simple Heuristics” plug-in to filter the log so that only the task “Repair (Simple)+start”, “Repair (Simple)+complete”, “Repair (Complex)+start” and “Repair (Complex)+complete” are kept. (Hint: Use the Log Summary to check if the log is correctly filtered!).
- Run the “Mine for a Handover-of-Work Social Network” on the filtered log:
- Select the filtered log in the workspace view.
- Select the “Action” button. This opens the action view with the filtered log selected as input.
- Select the “Mine for a Handover-of-Work Social Network plug-in.
- Select the “Start” button.
- Keep the default settings and select “Continue”.
- Select the options “size by ranking”, “stretch by degree ratio”, and set Mouse Mode to “Picking” (so you can use the mouse to re-arrange the nodes in the graph). You should get a result like the one in the figure below.
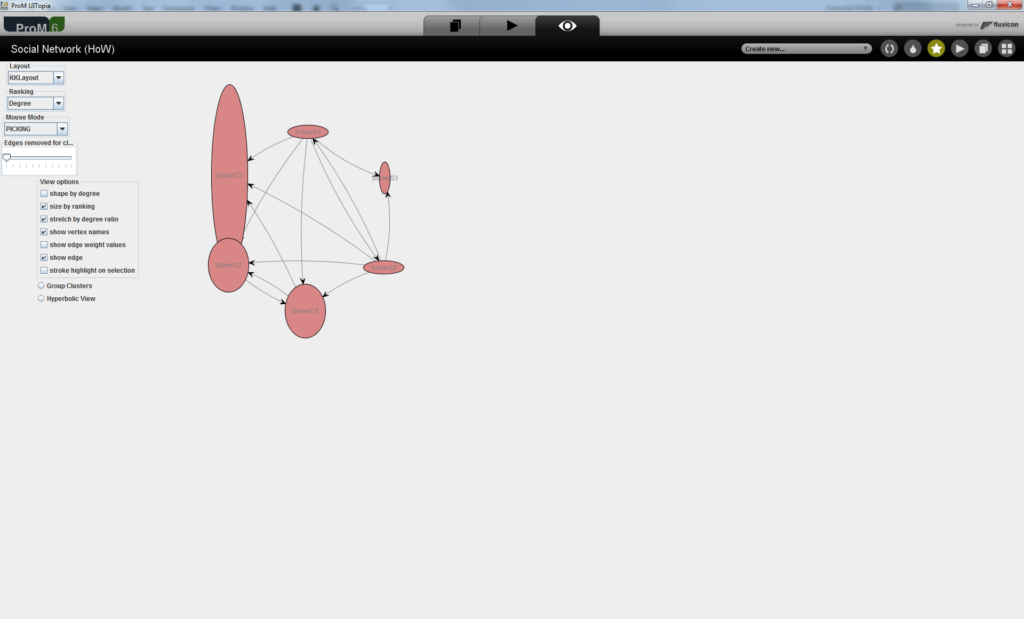
- The resulting graph shows which employees handed over work to other employees in the process instances of our running example. By looking at this graph, we can see that the employees with roles “SolverS3” (top-right node) and “SolverC3” (top-left node) outperform the other employees because the telephones these two employees fix always pass the test checks and, therefore, are not re-sent to the Repair Department (since no other employee has to work on the cases involving “SolverS3” and “SolverC3”). The oval shape of the nodes in the graph visually expresses the relation between the in and out degree of the connections (arrows) between these nodes. A higher proportion of ingoing arcs lead to more vertical oval shapes while higher proportions of outgoing arcs produce more horizontal oval shapes. From this remark, can you tell which employee has more problems to fix the defects?
Take you time to experiment with the plug-ins explained in the procedure above. Can you now answer the other remaining questions?