
The figure below shows the user interface of XESame. This section explains the basic features of this interface by explaining the different objects in this interface.
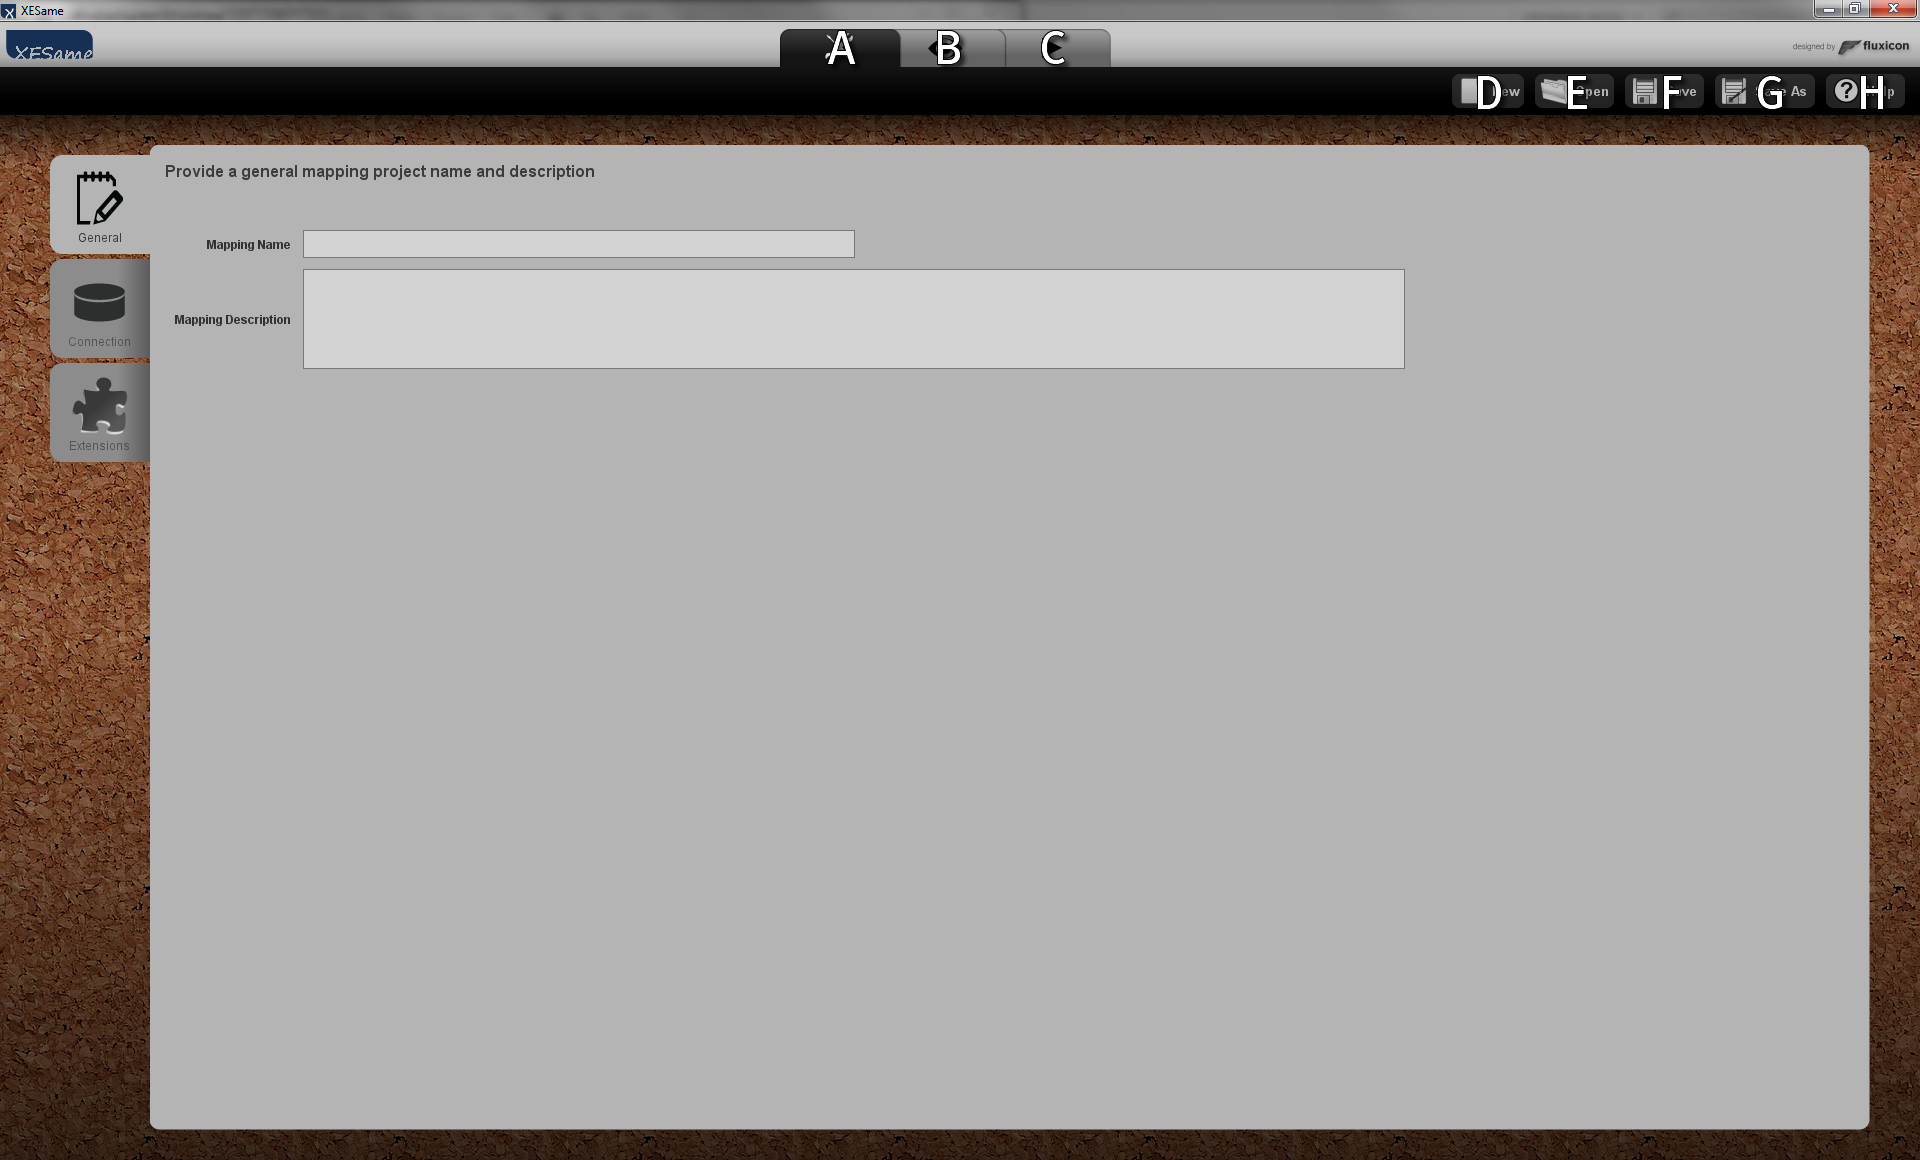
- A
The “Configuration” tab brings you to the configuration view. - B
The “Mapping” tab brings you to the mapping view. - C
The “Action” tab brings you to the action view. - D
The “New” button creates a new mapping. - E
The “Open” button imports a mapping from file. - F
The “Save” button exports a mapping to file. - G
The “Save as” button exports a mapping to another file. - H
The “Help” button shows some help on XESame 1.x.
Configuration view
This section explains the configuration view. Basically, this view allows you to configure your mapping, like setting its name, specifying the connection to the source database, and changing the XES extensions to use. The figures below show the configuration view.


- A
The “General” tab brings you to the general configuration view, see the top figure. - B
The “Connection” tab brings you to the connection configuration view, see the middle figure. - C
The “Extensions” tab brings you to the extensions configuration view, see the bottom figure. - D
The “Mapping name” field allows you to provide a name to your mapping. - E
The “Mapping description” field allows you to provide a description to your mapping. - F
The “Test Connection” button tests the connection to the JDBC database using settings as provided at (G) to (L). - G
The “URL to database” field allows you to provide the URL to the JDBC database. - H
The “JDBC Driver” field allows you to choose your favorite JDBC driver. - I
The “Select.jar driver file” button allows you to specify the path to an alternative JDBC driver. This path will be displayed by the “JDBC Driver Location” field. - J
The “Connection properties” table allows you to specify additional connection properties. - K
The “SQL Query Column Separator” fields allow you to set alternative column separators. - L
The “Connection description (optional)” field allows you to provide a description for your connection. - M
The “Add Extension” button adds an extension to the extension pool (O). - N
The “Remove Extension” button removes the selected extension from the extension pool (O). - O
The extension pool shows the current collection of extensions for the log to be generated.
Mapping view
This section explains the mapping view. Basically, this view allows you to define your mapping, that is, to define which XES attributes (on the log, trace, event, or attribute level) should be included where in the XES log, and how the value of these attributes can be retrieved from the source database. Furthermore, this view also allows you to view the links between XES attributes and source database in a graphical way (the mapping visualization). The figures below show the mapping view.


- A
The “Definition” tab allows you to edit your mapping definition, see the first three figures. - B
The “Visualization” tab allows you to view your mapping definition, see the fourth figure. - C
The “Add event” button adds an event definition to the trace definition. - D
The “Remove event” button removes the selected event from the trace definition. - E
The “Add attribute” button adds an attribute definition to the selected log, trace, event, or attribute definition. - F
The “Remove attribute” button removes an attribute definition from the selected log, trace, event, or attribute definition. - G
The tree view shows the log, trace, event, and attribute definitions and allows you to select one. Details on the selected object will be shown in (M). - H
The “Attributes” tab (first figure) allows you to edit the attributes of the selected object. - I
The “Properties” tab (second figure) allows you to edit the properties of the selected object. - J
The “Add attribute” button adds an attribute to the object. - K
The “Remove attribute” button removes the selected attribute from the object. - L
The “Promote attribute” button adds a child attribute to the object. - M
The attribute pool for this object. - N
The “Add link” adds a link from the “From” table to another table. - O
The “Remove link” button removes the selected link. - P
The properties pool for this object. - Q
The “Classifiers” tab (third figure) allows you to edit the classifier pool (T), which will act as the collection of classifiers in the resulting log. - R
The “Add Classifier” button adds a classifier to the classifier pool (T). - S
The “Remove Classifier” button removes the selected classifier from the classifier pool (T). - T
The classifier pool for the log to be generated. - U
The “Clear and Rebuild Visualization” performs a deep redraw of the mapping visualization. - V
The “Update Visualization” performs a shallow redraw of the mapping visualization. - W
The “Export Visualization” exports the mapping visualization to a number of graphic formats, like PNG, BMP, JPG, and SVG. - X
The mapping visualization.
Action view
This section explains the action view. Basically, this view allows you to control and monitor the execution of the mapping, that is the generation of the XES log from the source database using the mapping configuration and definition as specified by the previous two views. The figures below show the action view.


- A
The “Settings” tab allows you to change the conversion settings, see the first figure. - B
The “Console” tab allows you to view conversion progress and any conversion messages, see the second figure. - C
The “Execute Conversion” button executes the conversion, that is, it runs the defined mapping against the specified database and stores the results in an intermediary database, and afterwards it exports the contents of this intermediary database into an event log. - D
The “Number of trace . . . ” field allows you to specify how many traces the generated log should contain. Especially when testing the mapping this number should be set low. - E
The two check marks control whether the resulting event log is in the XES format or in the MXML format, and whether it will be compressed or not. - F
The “Change CacheDB Location” controls the location of the intermediary database on the disk. This location is reflected by the “Location of . . . ” field. - G
The “Change event log file location” controls the location of the resulting log on the disk. This location is reflected by the “Output event . . . ” field. - H
The conversion message console. - I
The “Clear Console” button clears the console (H). - J
The “Minimum message level” dropdown list controls the level of messages to show in the console. Possible levels are (from high to low) “ERROR”, “WARNING”, “PROGRESS”, “NOTICE”, and “DEBUG”. - K
The progress indicator shows the progress of the conversion.